
Helix MTF Indicator
Decision quality.
Not signal quantity.
Turn chart clutter into structured TradingView decision support.
The Helix MTF Indicator combines multi-timeframe bias, trend context, key price levels, scoring, volatility awareness, relative strength, and signal logic into one clean TradingView overlay - designed to standardize the read on your chart, not multiply the noise.
WHY HELIX MTF EXISTS
Most traders do not need more indicators. They need a cleaner read.
Stacked panels and disconnected scripts don’t produce structure. They produce conflict. Helix MTF takes a different approach.
Too many disconnected tools
Most traders stack indicators that do not speak to each other — six panels, a dozen overlays, no shared logic. The result is conflict, not confluence.
Signals without context
A buy or sell label alone is not enough. Without trend, levels, volatility, and multi-timeframe agreement, the signal is just noise with a color.
One structured workflow
Helix MTF organizes the key context into dashboards, scores, and chart-based decision support — designed to surface a structured read instead of stacking partial ones.
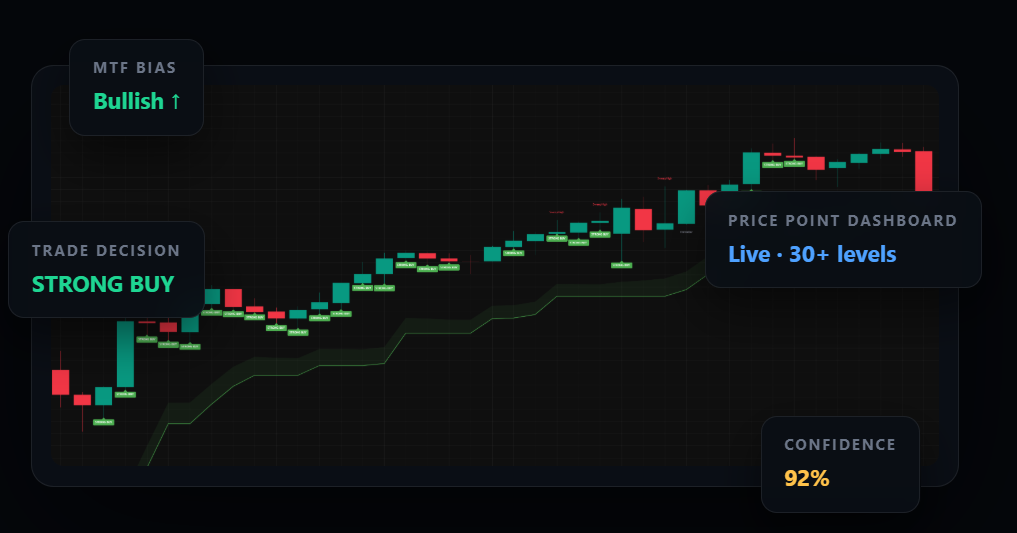
Bullish trend continuation
WHAT’S INCLUDED
Twelve modules. One overlay.
Bias Dashboard
Real charts. Two-way market context.
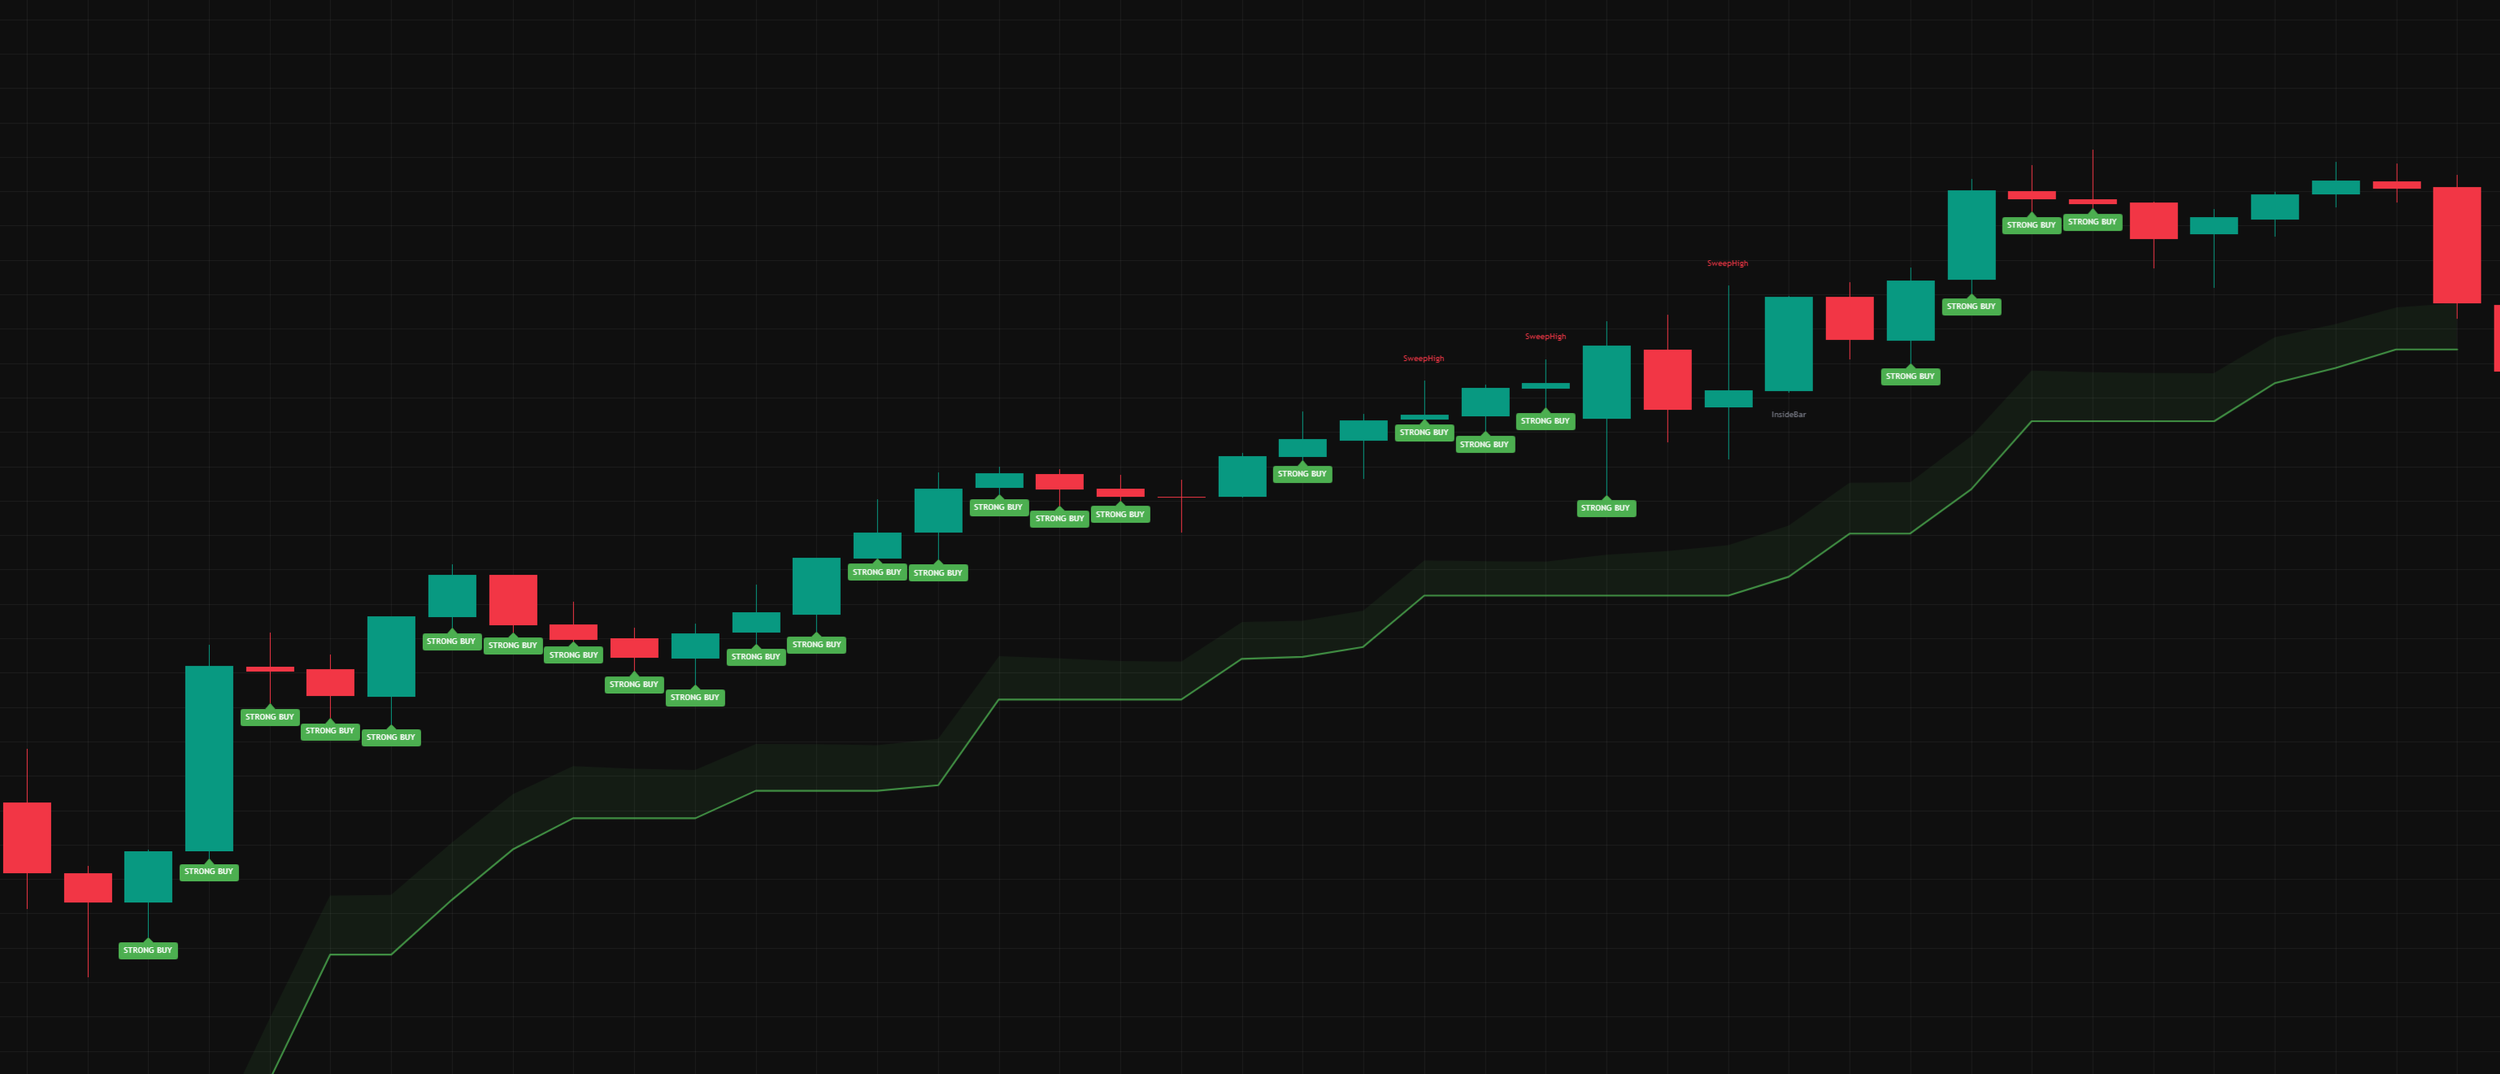
Example 01 · Bullish
Every major piece of context a discretionary or systematic trader needs consolidated into one structured TradingView overlay.
Multi-Timeframe Bias Table
1-minute through Quarterly bias rows with VIX and Opening Range, scored on alignment.
Price Point Live Dashboard
Major levels, pivots, MAs, VWAP, opening range, volatility, RS, scores — live on chart.
Trend Strength Score
0–100 reading combining EMA alignment, VWAP, MACD, Supertrend, and ADX.
Trade Probability Score
0–100 confluence reading across 12 components — alignment, momentum, location, volume, volatility.
Decision Engine
Six clear states: Strong Buy, Buy, Neutral, Sell, Strong Sell, Avoid — surfaced on the chart.
Confidence Score
A live confidence reading paired with the decision state for at-a-glance setup quality.
Strong Buy / Strong Sell
Chart-based directional labels confirmed at bar close, with an active swing filter in the baseline.
Supertrend Structure
ATR-based trend overlay with background fill, smoothed strength reading, and trend confirmation.
Liquidity Sweep Detection
Bar-close confirmed labels for failed breakouts and stop-run rejections at recent extremes.
Relative Strength
Live comparison vs. QQQ and SPY benchmarks — surfaces leadership, not just direction.
Volatility State
Squeeze / Normal / Expansion classification from Bollinger Band vs. Keltner Channel logic.
Stock Presets
Optional one-click configurations for NVDA, AAPL, AMD, TSLA, and META on selected timeframes.
SIGNATURE DASHBOARDS
Two on-chart dashboards do most of the work.
Shows bullish structure with Strong Buy labels appearing in sequence along a rising Supertrend band — the kind of confluence the indicator is designed to surface.
The Multi-Timeframe Bias Table and the Price Point Live Dashboard are where the indicator’s decision-support layer lives.
Multi-Timeframe Bias Table
Bias across multiple timeframes — 1m, 5m, 15m, 30m, 1h, 2h, 4h plus 3-Day, Weekly, Monthly, Quarterly
Tracks moving average structure, VWAP, MACD, Supertrend, ZLSMA, RSI, and ADX in one place
Helps traders see alignment or conflict at a glance - per-row average % agreement
Includes a VIX Fear Index row and an Opening Range Breakout row for added market context
Designed to reduce the need to flip across multiple charts to read confluence
Live Dashboard
Price Point Live Dashboard
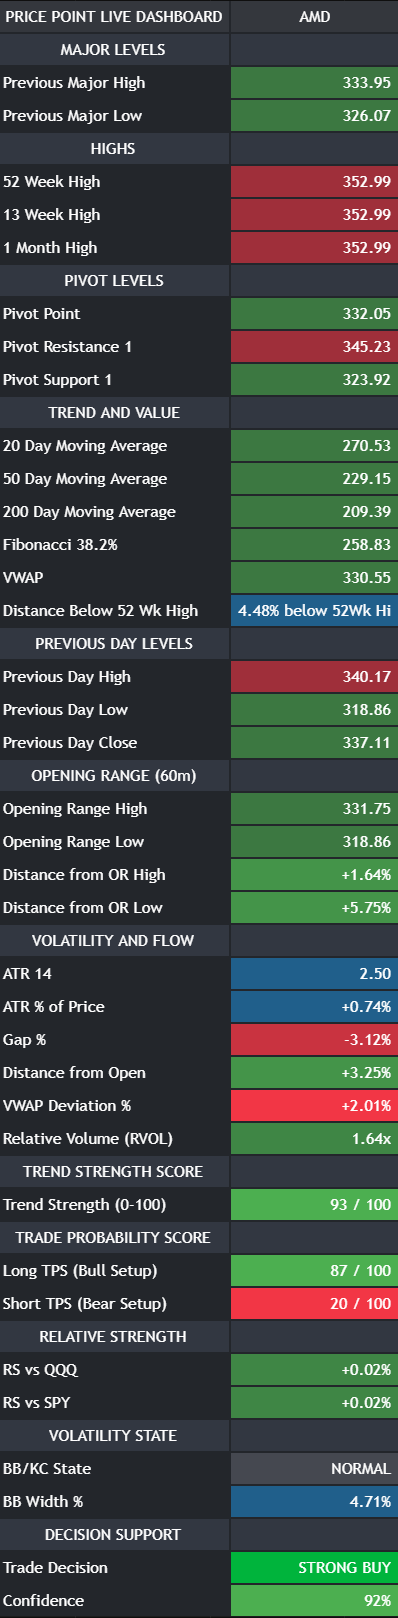
Major levels, pivots, MAs, VWAP, Fibonacci 38.2%, previous day levels, opening range
Volatility & flow metrics (ATR, Gap%, RVOL) plus relative strength vs. QQQ and SPY
On-chart Trend Strength Score, Trade Probability Score, and decision support
Helps traders see where price is positioned relative to every key reference level
Converts raw chart context into a structured, scannable dashboard
SCORING AND DECISION SUPPORT
Two scores. Six states. One structured read.
The scoring layer condenses dozens of inputs into readings you can act on without leaving the chart.
A composite reading of trend quality — combining EMA alignment, VWAP location, MACD momentum, Supertrend direction, and ADX-style trend confirmation. Designed to quantify whether conditions support a trend-following setup.
Multi-timeframe alignment, EMA stack, VWAP location, MACD, Supertrend, ADX strength, relative volume, opening range, relative strength, volatility state, and key level proximity — condensed into one composite confluence reading.
The scoring layer resolves to one of six readable states — surfaced directly on your chart with a paired confidence reading.
The scores are designed to support structured decision-making, not to guarantee outcomes. Helix MTF surfaces context; the trade decision still belongs to the trader.
INDICATOR IN ACTION
Helix MTF is built to read both directions of the market: bullish, transitional, and defensive conditions all surface through the same structured workflow.
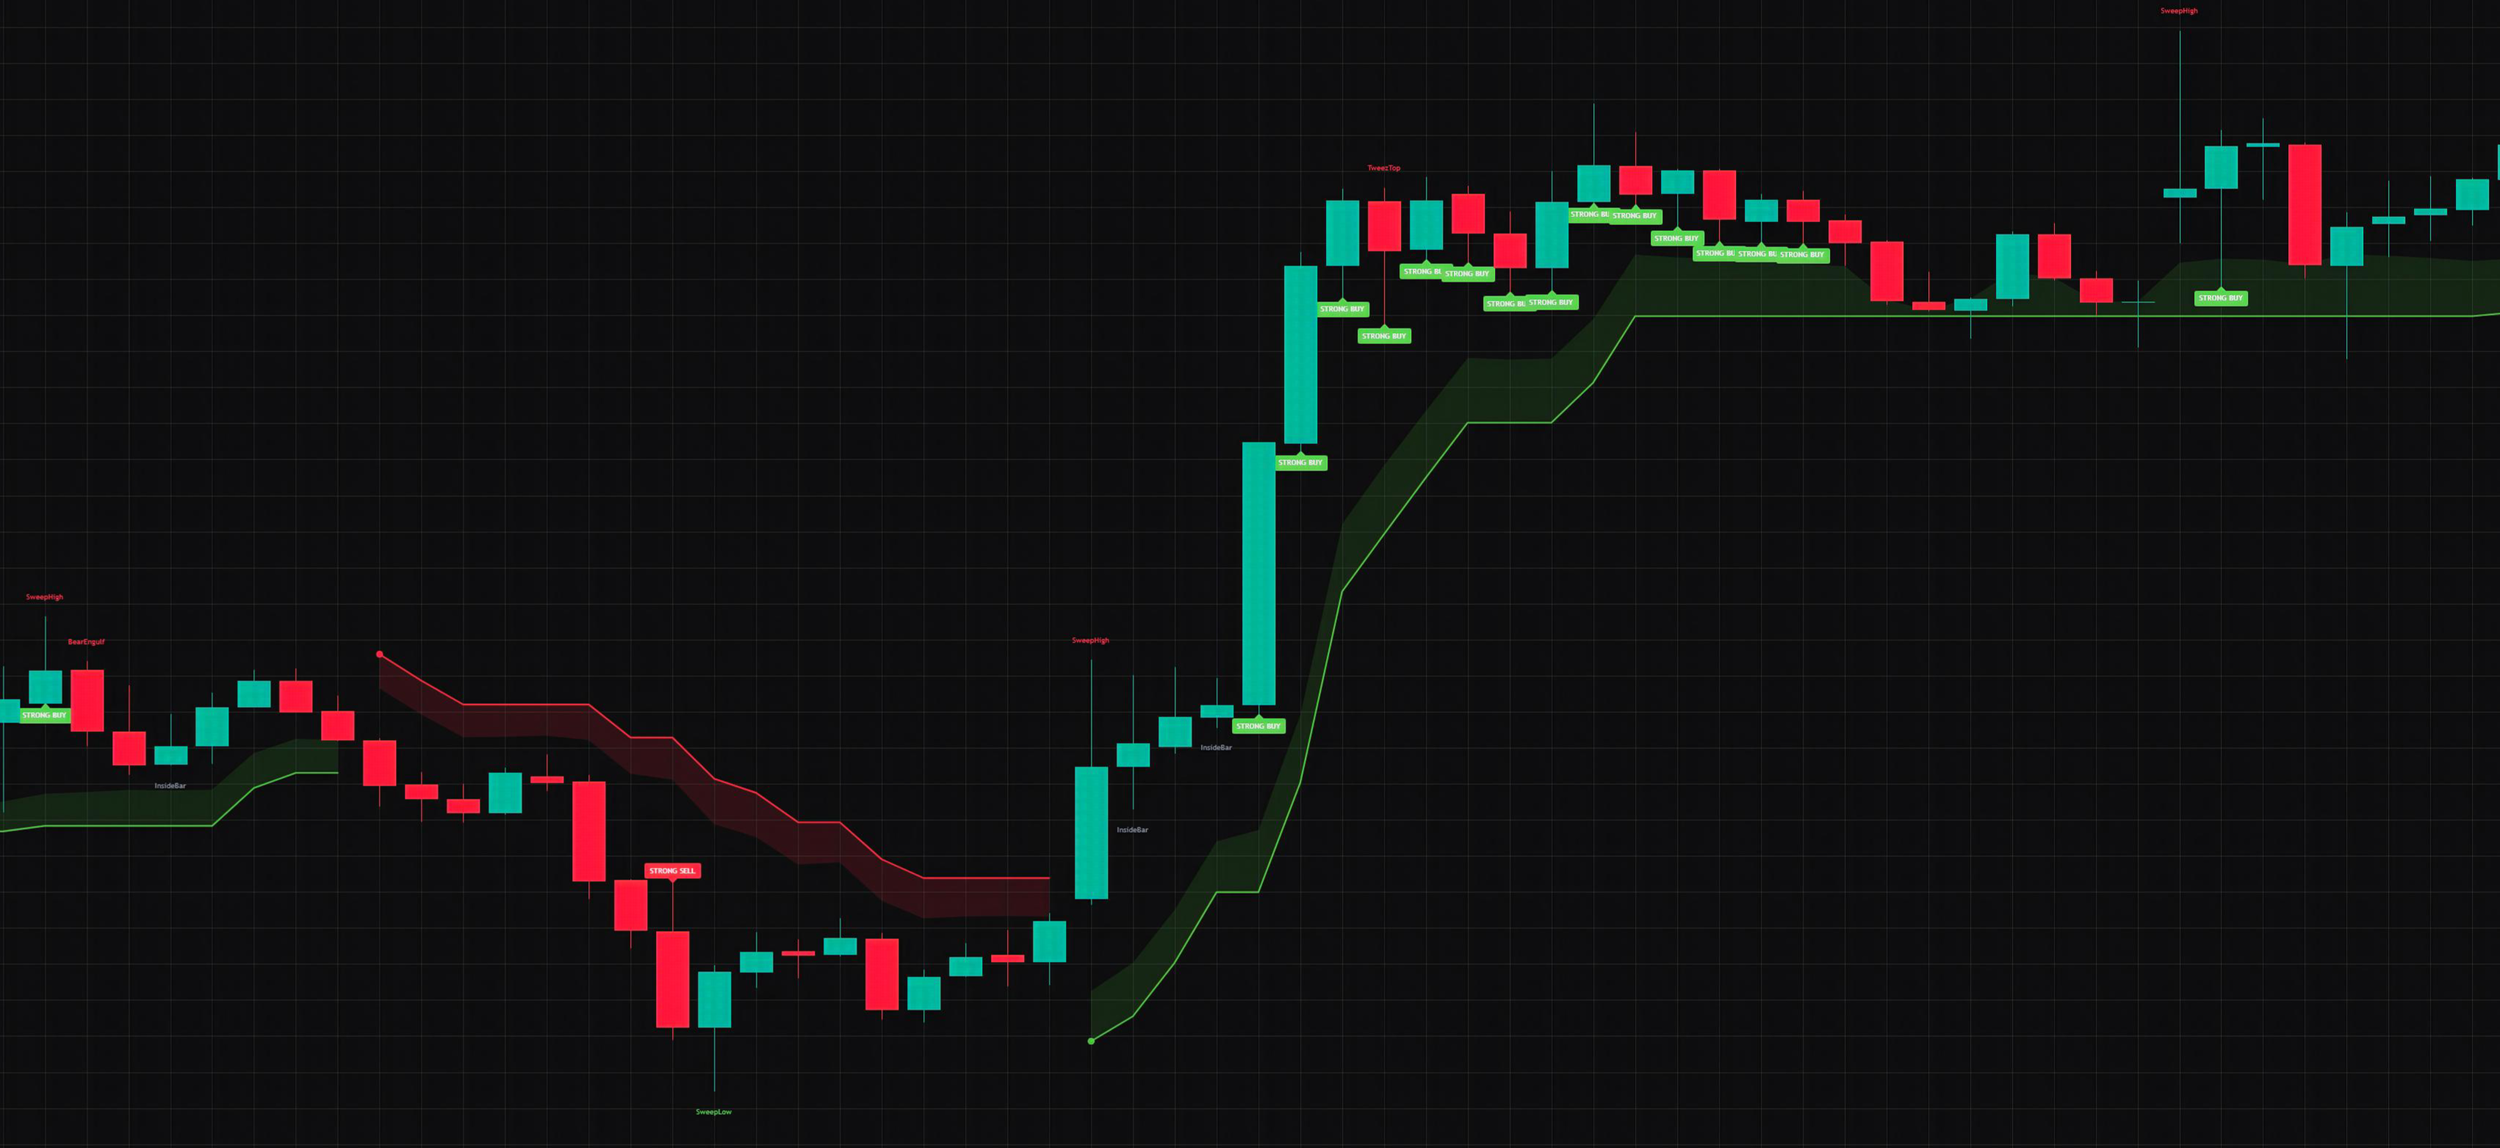
Example 02 · Transition
Breakout and structural transition
Helps visualize a regime change — from a defensive Strong Sell zone into a clear breakout with consecutive Strong Buy confirmations as conditions improve.
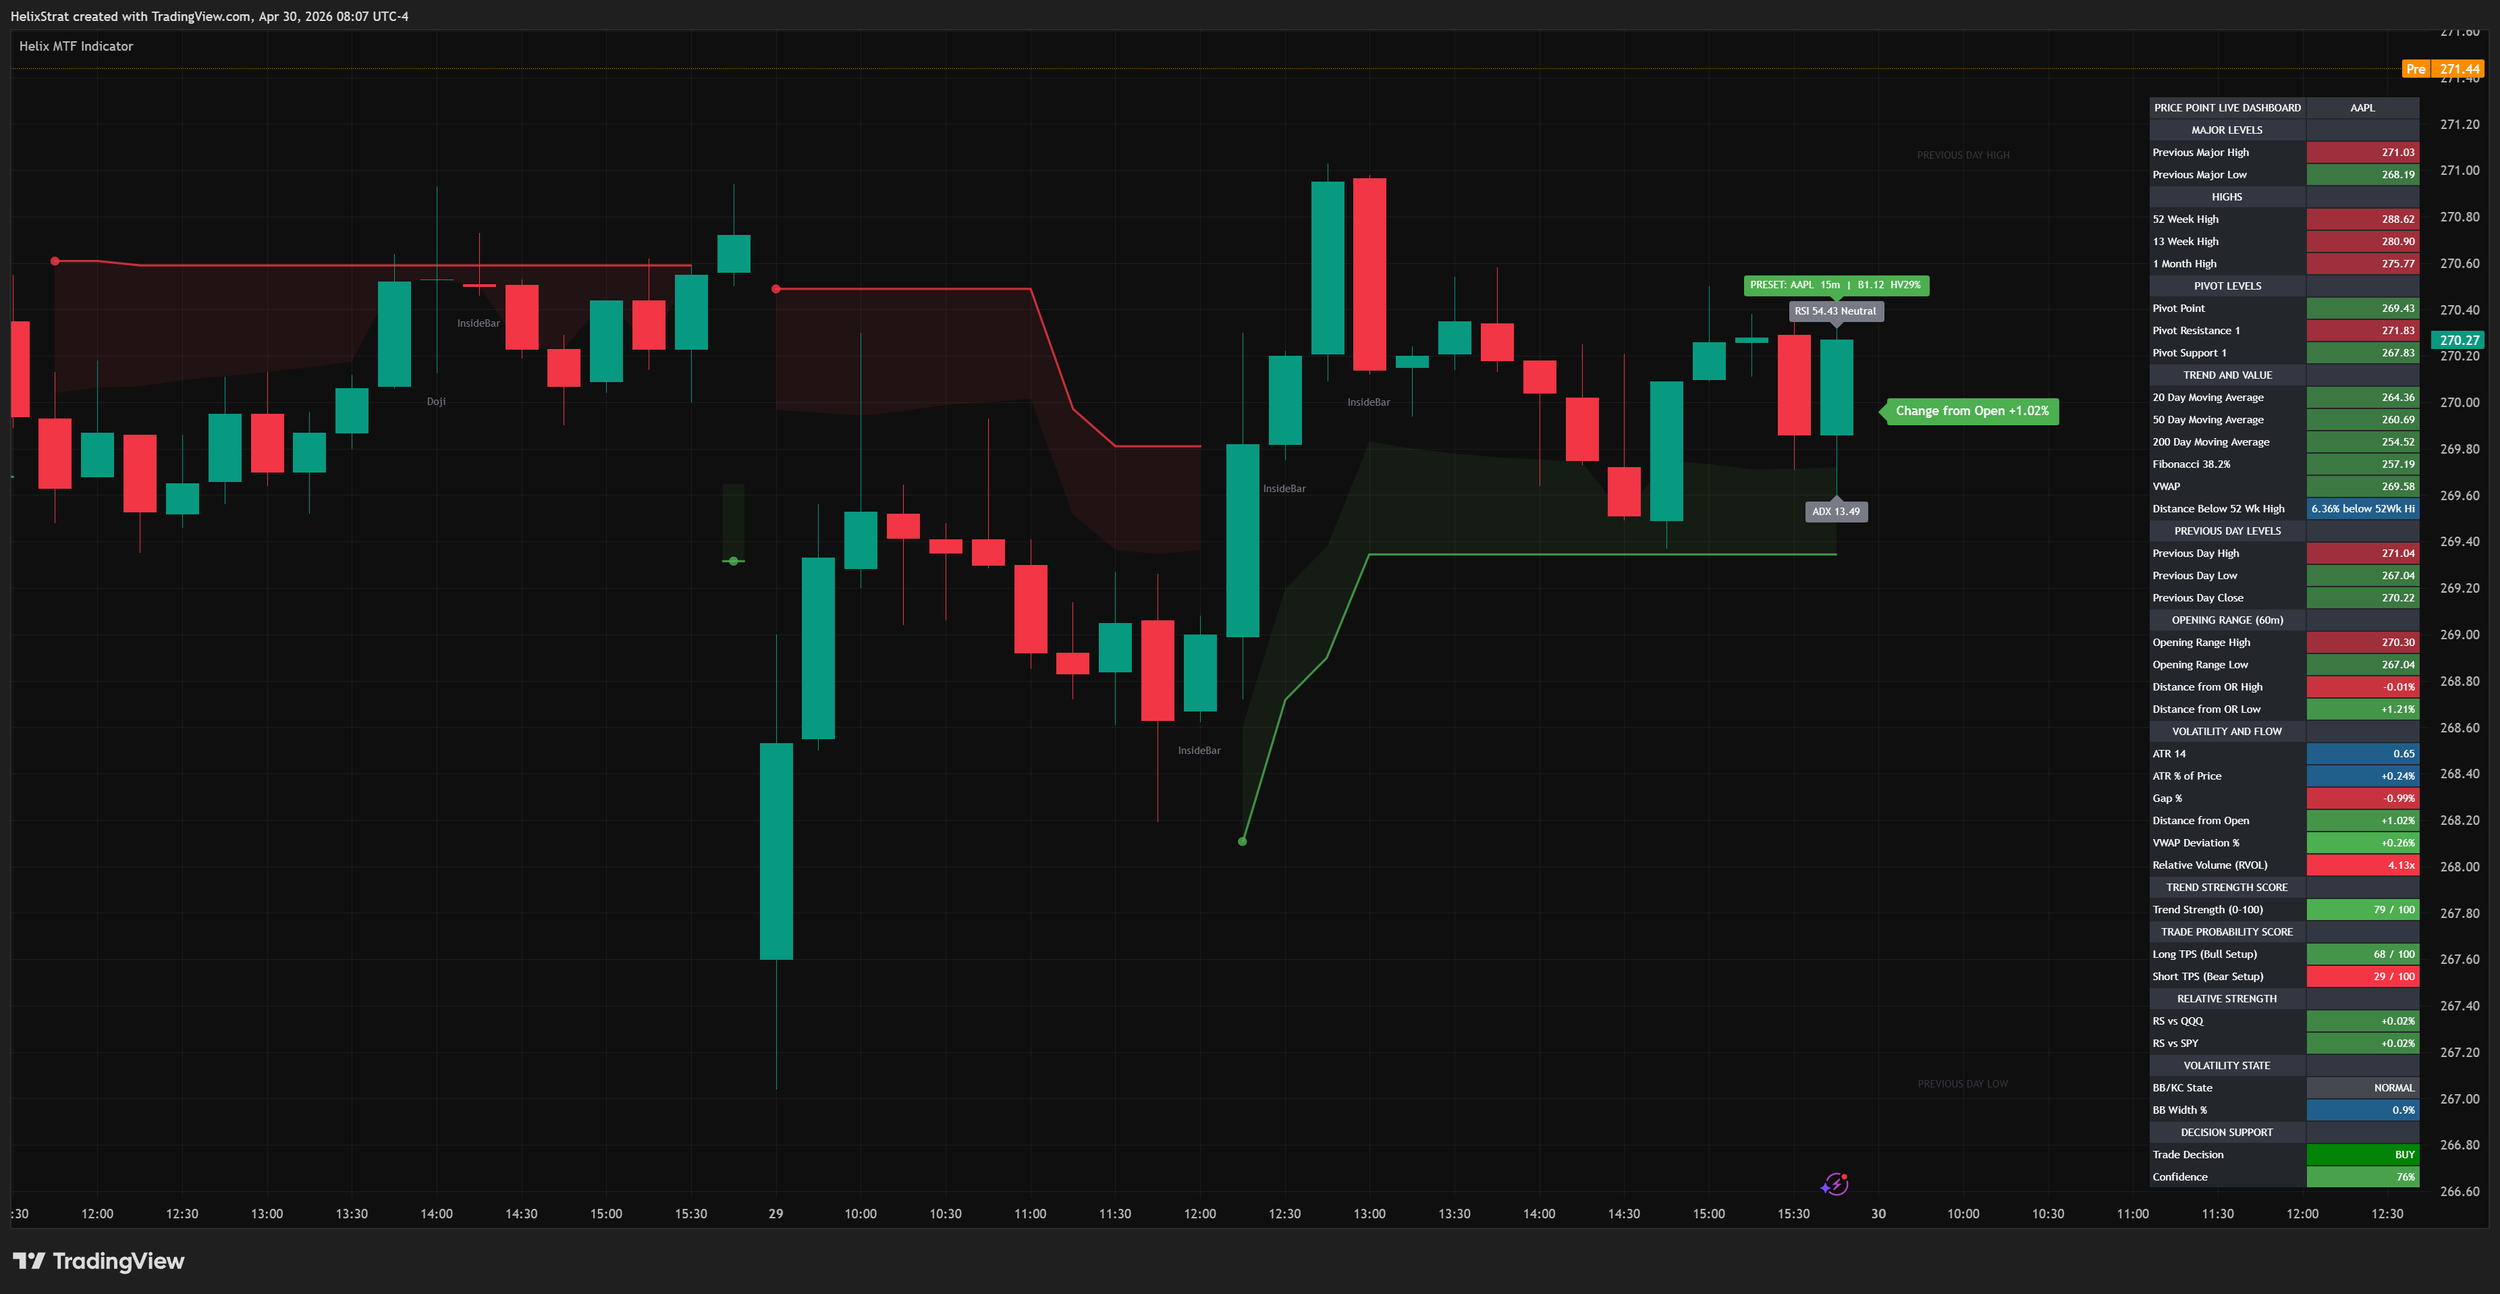
Full workflow example — AAPL with Price Point Live Dashboard
Dashboard, levels, trend structure, and chart labels working together
WHY IT’S DIFFERENT
Helix MTF was built to fix the parts of the standard indicator workflow that produce the most confusion.
Click to expand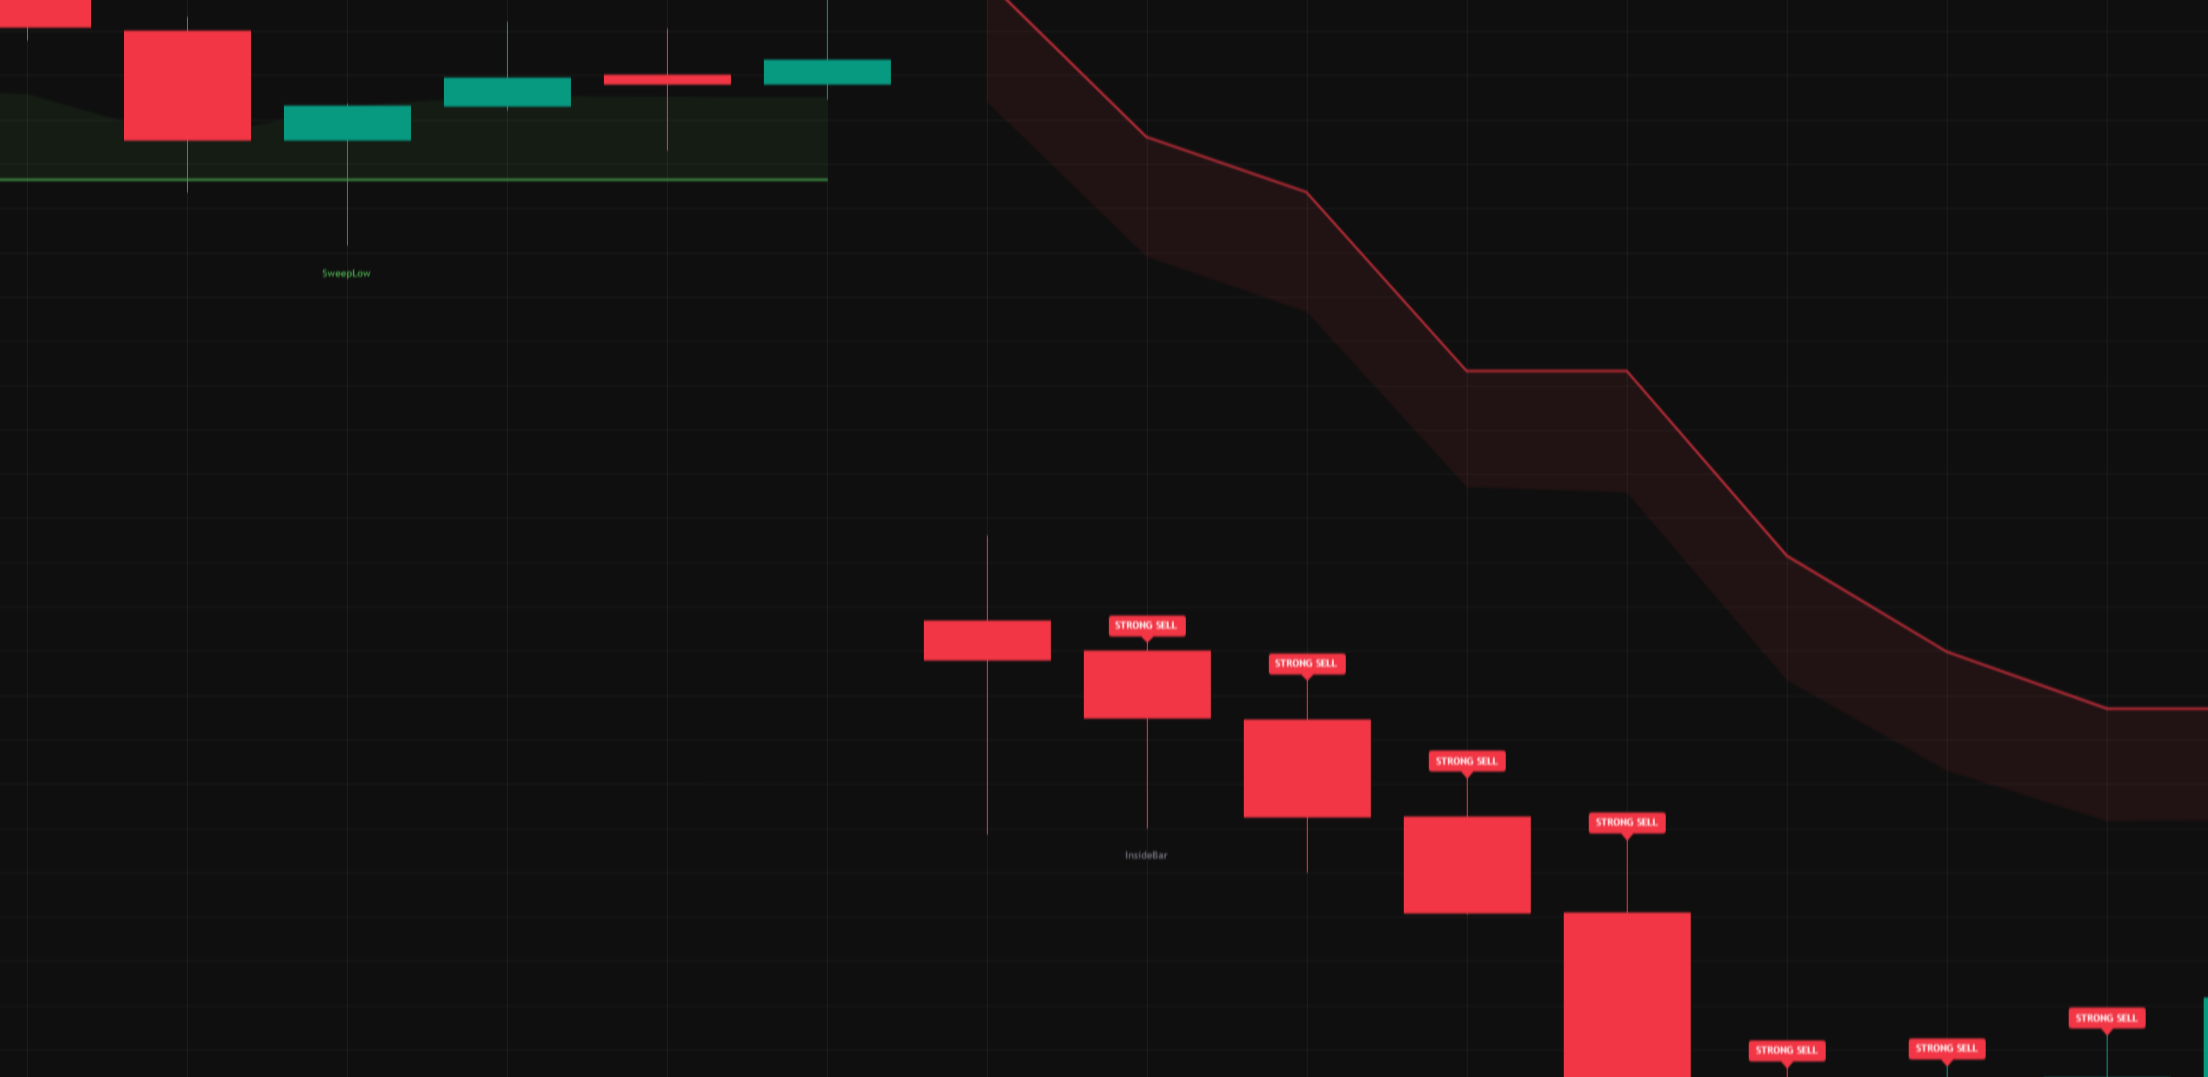
Example 03 · Bearish
Bearish or defensive conditions
Helix MTF is not only bullish. The same structured logic surfaces Strong Sell context and bearish structure when the chart turns defensive.
Three things basic indicators don’t do.
Context before signal
Most indicators print a label and stop. Helix MTF surfaces the context behind the label — the bias, the levels, the volatility state, and the score — so the label is read inside its environment, not in isolation.
Dashboard-driven workflow
The Multi-Timeframe Bias Table and the Price Point Live Dashboard create a repeatable on-chart process — the same structure is read every time, instead of improvising across a stack of disconnected overlays.
Flexible by design
The baseline configuration is intentionally clean. As you grow comfortable, you can layer in advanced filters, stock presets, alerts, and scoring visuals — without rebuilding the system from scratch.
CONFIGURATION PREVIEW
Baseline simplicity. Advanced control when you want it.
Helix MTF is organized around sixteen configurable input groups. The baseline is designed to keep the chart readable from the moment you add the indicator. Every advanced filter, score visual, and risk-awareness layer is a toggle not a rebuild.
Subscribers receive the complete Input Settings and Quick Reference Guides covering every group, default value, and recommended workflow.
MEMBER RESOURCES
-
Fast 10 EMA, Medium 20 EMA, and Long 200 SMA on by default. Optional 50 SMA available as an additional trend layer.
-
Optional session-anchored VWAP with a first-band volatility envelope. Off in the baseline to keep the chart cleaner; auto-hidden on daily and higher timeframes.
-
Classic 12 / 26 / 9 momentum confirmation with distance and ATR-based separation filters to reduce weak readings.
-
Optional zero-lag SMA smoothing layer. Off in the baseline; available when traders want a calmer trend reference.
-
Chart-based BUY / SELL labels with bar-close confirmation and an active swing filter in the baseline.
-
Suggested stop loss with a 10-bar visual limit and R1 / R2 take profit targets visible by default. R1.5 and R3 are optional.
-
10-period ATR with a 2× multiplier and trend-colored background fill. Auto-hidden on daily and higher timeframes.
-
Optional MACD-zero gate, relative volume, Donchian breakout, squeeze block, and strong-only filters — layered in deliberately for tighter conditions.
-
Item descriptionCompact multi-timeframe dashboard in the top-right with VIX, opening range, MA alignment, momentum, and trend-strength rows.
-
Centralized live panel for key levels, swing highs and lows, relative volume, scores, decision support, and market context.
-
On-chart 0–100 readings for trend quality and 12-component setup confluence, surfaced inside the dashboard.
-
On-chart 0–100 readings for trend quality and 12-component setup confluence, surfaced inside the dashboard.
-
Optional benchmark comparison versus QQQ and SPY to surface leadership or lag versus the broader market.
-
Bollinger Band and Keltner Channel-based classification across Squeeze, Normal, and Expansion regimes.
-
Optional one-click configurations for NVDA, AAPL, AMD, TSLA, and META. Default is None for full manual control.
-
Optional advanced score-based visuals and alerts, plus a daily stop-loss-hit warning that activates after the configured threshold.
STOCK PRESETS
Optional one-click setups.
Stock presets are starting points, not guaranteed configurations. The baseline default is None — full manual control.
None
The default selection. Keeps the indicator on the standard manual baseline so traders start from a clean foundation.
NVDA
Balanced but selective setup with moderate UT Bot sensitivity, 9 / 21 moving averages, and a 2.2 Supertrend multiplier.
AAPL
Smoother confirmation setup with calmer UT Bot reading, 9 / 20 moving averages, and a 1.8 Supertrend multiplier.
AMD
Trend-focused setup tuned for a more volatile name — longer swing lookback and a 2.5 Supertrend multiplier.
TSLA
Volatility-aware setup with higher UT Bot sensitivity, longer ATR, and a 3.0 Supertrend multiplier for wider intraday swings.
CONFIGURATION PREVIEW
Built around four trader profiles.
Helix MTF is designed to grow with the trader. Providing a clean baseline at the start, and then deeper customization as you build a workflow.
Foundational Trader
Wants a cleaner way to understand trend, levels, and bias without rebuilding TradingView from scratch.
Strategic Trader
Wants a structured confluence checklist on the chart — bias, scores, key levels, and bar-close confirmation.
Advanced Trader
Wants configurable filters, scoring layers, alerts, and dashboard logic to fit a personal trading process.
Expert Trader
Wants a fast decision-support layer that can be tuned into a repeatable, journaled, multi-symbol workflow.
Want the full Indicator settings guide?
Subscribers can access the complete Helix MTF Indicator Input Settings Guide, quick reference guides, and setup resources inside the member area.
Bring structure to your
TradingView workflow.
Helix MTF gives traders a cleaner way to read trend, levels, scoring, volatility, relative strength, and decision support from one chart, all in one structured workflow.
All-In-One Plan. One subscription. Both TradingView scripts.